Learn with Lynda: Infographics Fundamentals
This month, on my way back from an event in London, I watched the ‘Infographics Fundamentals‘ course by Amy Balliett.
Information graphics or infographics are graphic visual representations of information, data or knowledge intended to present information quickly and clearly.
In this course, which is only 1h 11m long, the author shows viewers how to create engaging and successful infographics that will stand out from the crowd. She explains the science behind good visual communication, reviews the different types of infographics, and introduces design principles and techniques that will help you build engaging and successful infographics.
Topics include:
- Why visual communication matters
- Types of infographics
- Focusing on message and accuracy
- Researching the infographic
- Building a wireframe design
- Working in Adobe Illustrator
- Publishing and marketing your infographic
In Higher Education, infographics can be a great tool for summarising or conveying important information to students about a particular topic. You can also ask students to create infographics as poster presentations, as they require critical research into a topic, and presentation/visualisation of information and data in a clear and concise way. Not to mention that creating infographics, and using tools suck as Piktochart or Adobe Illustrator, contributes to developing students digital capability, one of the new YSJ Graduate Attributes.
You can read more about teaching with infographics in this article: Teaching with Infographics: Practicing New Digital Competencies and Visual Literacies.
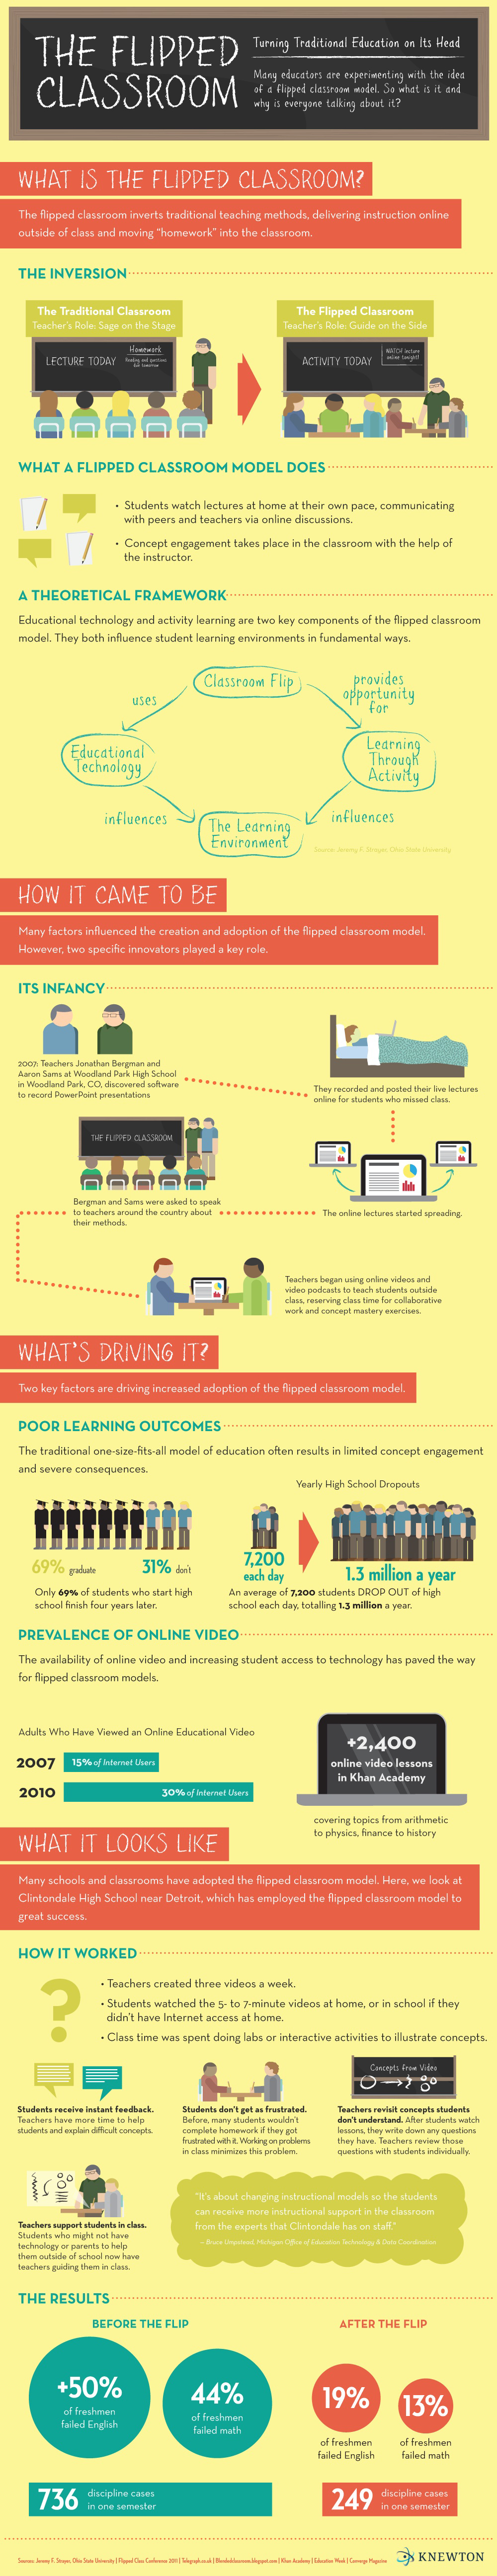
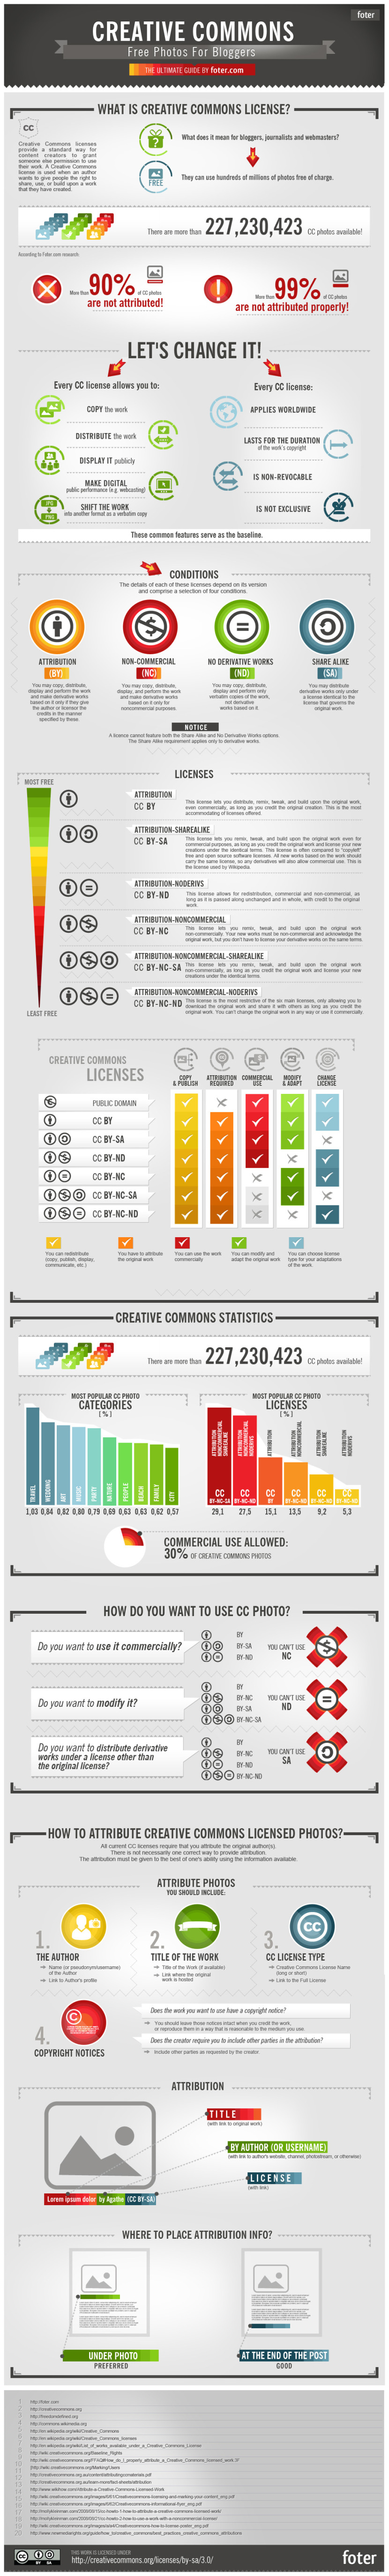
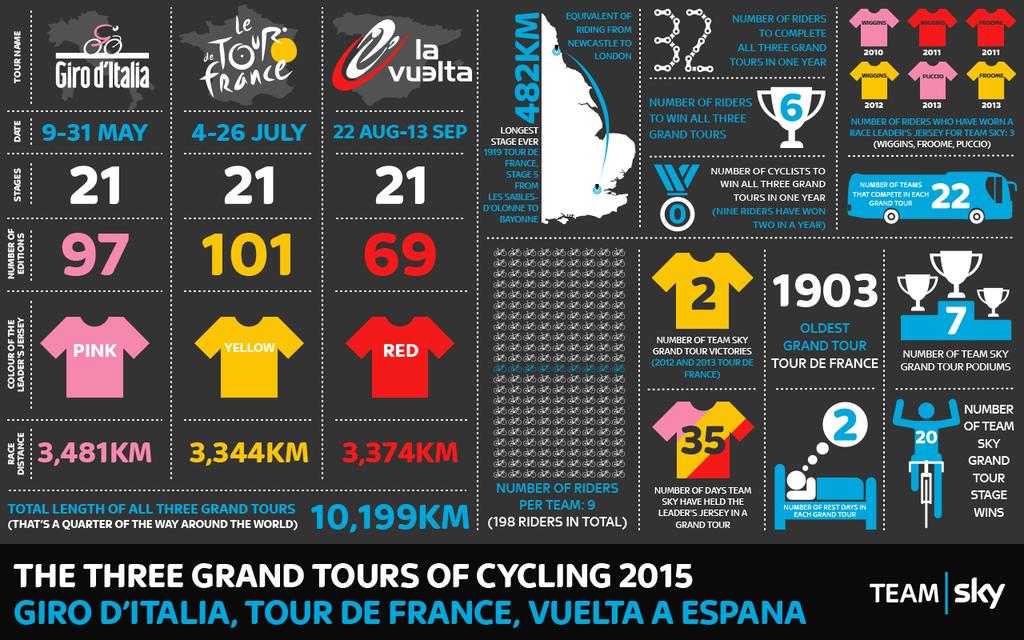
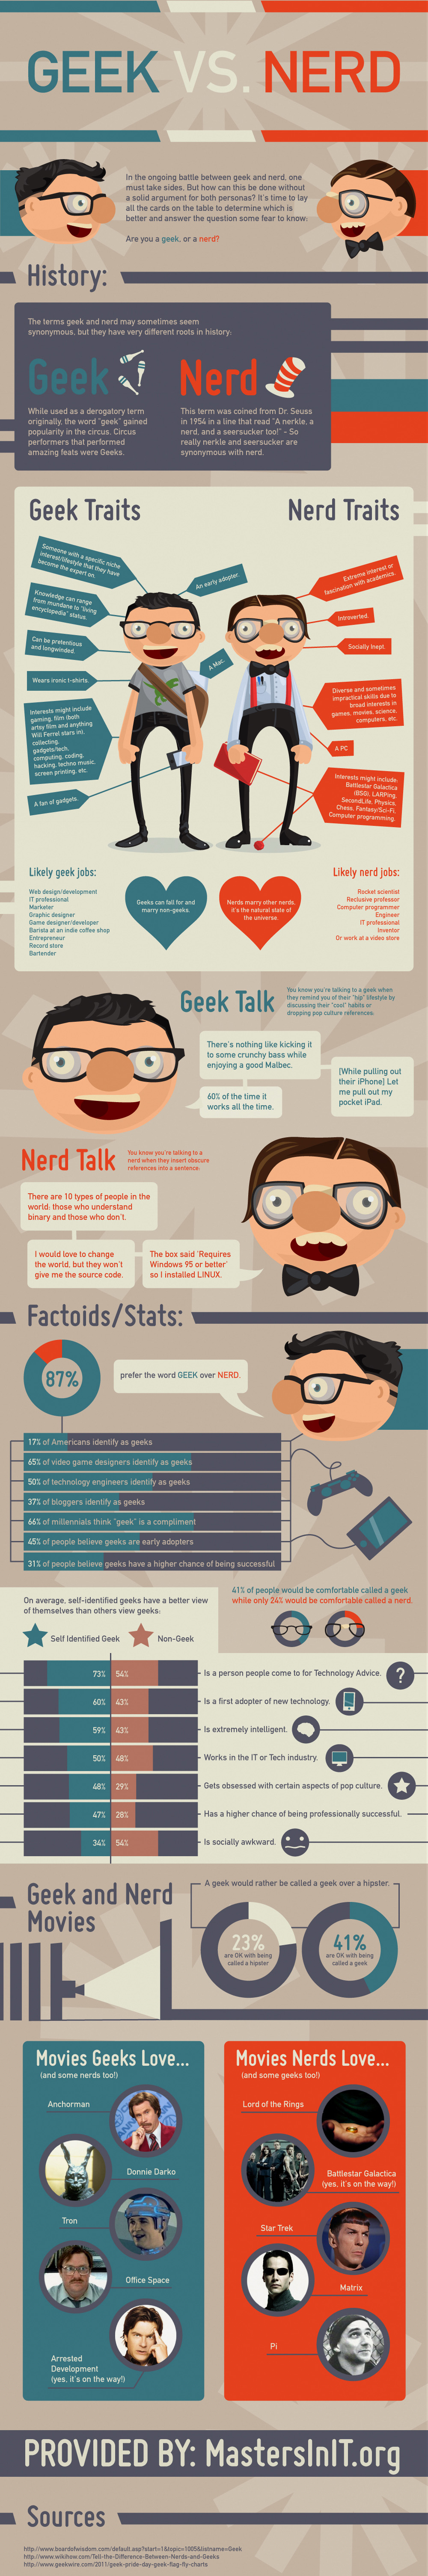
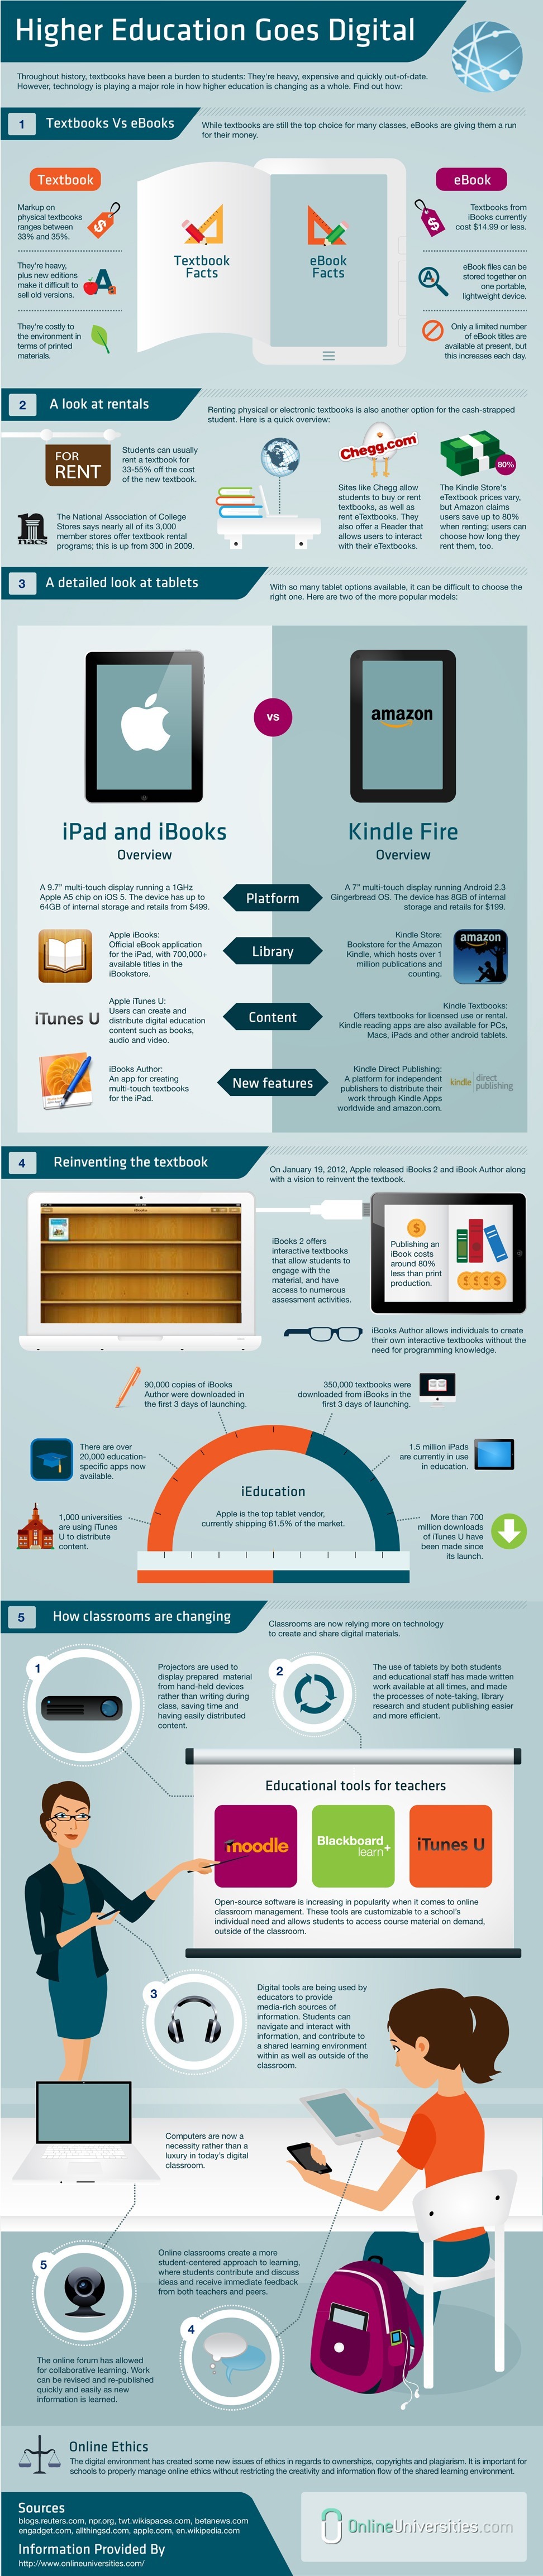
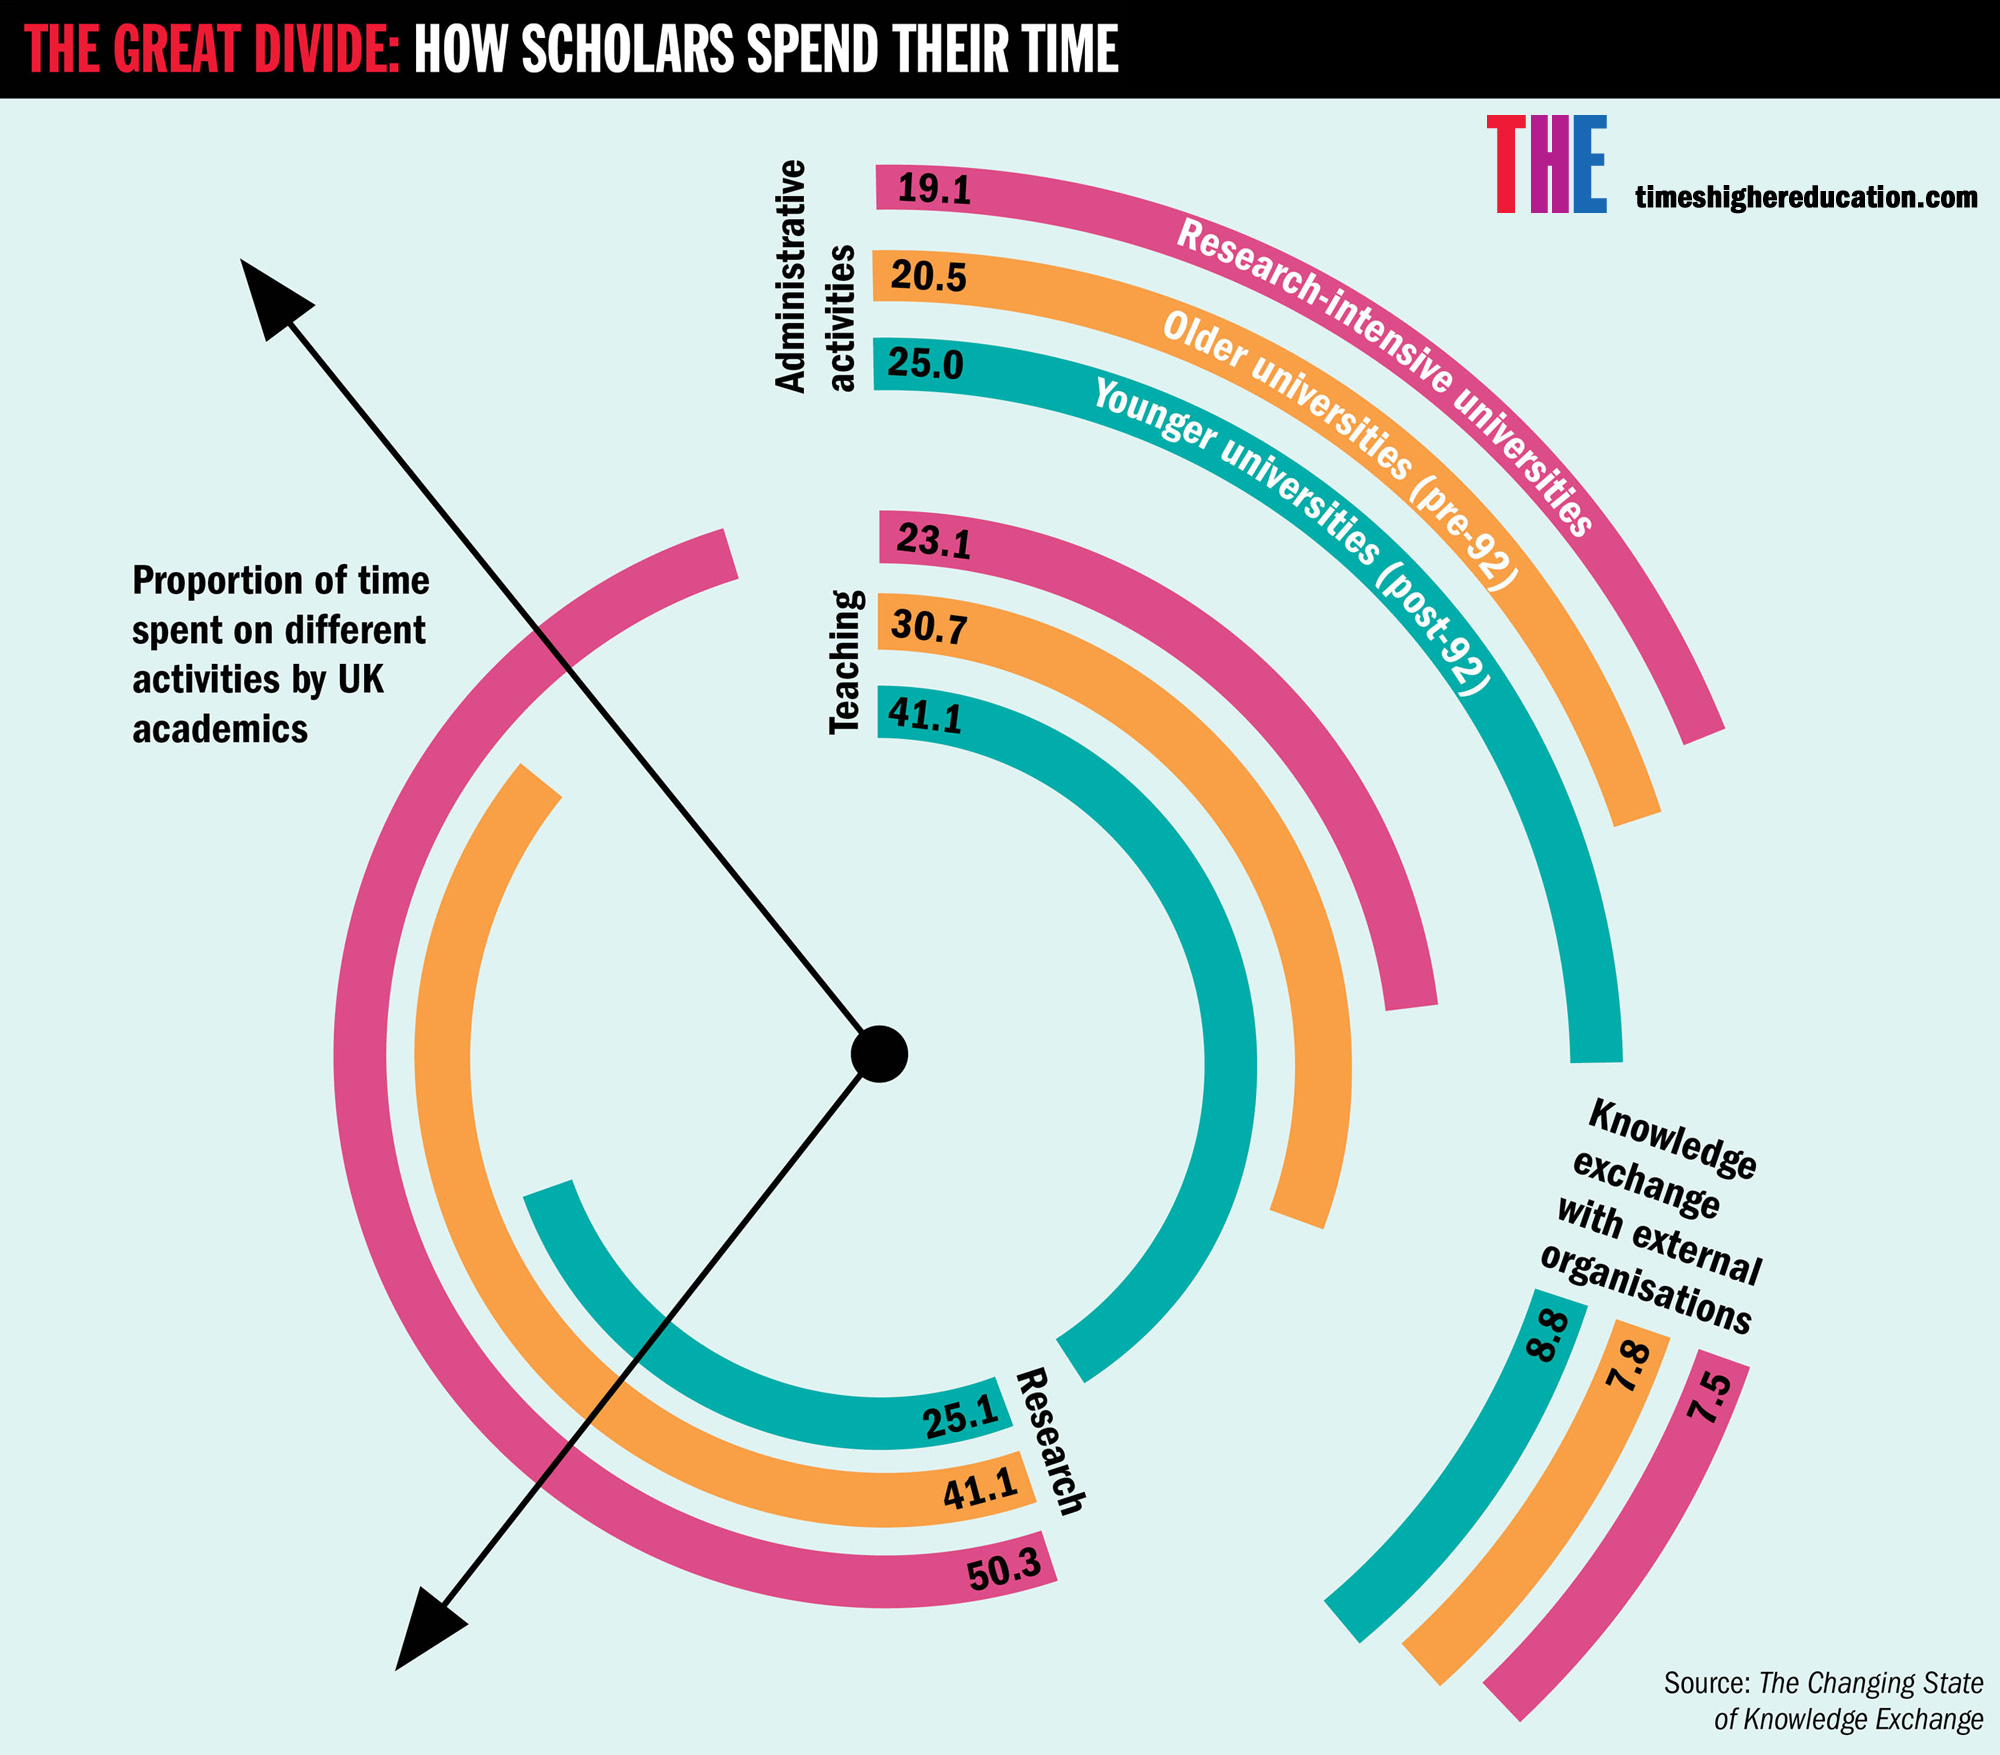
Pinterest is a great source of infographics on all kinds of topics, here are a few interesting ones I have picked out:


If you’d like to find out more about creating infographics using a simple tool like Piktochart then why not come along to our ‘TEL Me About…Piktochart‘ session on 6th June. Alternatively, for a more in-depth approach, the Digital Training team in ILS offer regular Adobe Illustrator Workshops.
Do you use infographics in your teaching and learning? How might you use infographics in the future? Don’t forget to let us know what you think of the course! Was it helpful? Was there anything you would add? Any takeaways you can apply to your teaching or would like to explore further? Let us know in the comments below…
Phil
 P.S. Did you know? You can integrate your lynda.com course completion certificates with your LinkedIn profile – and share the skills and knowledge you’ve acquired. Simply ‘Share’ your certificate of completion and select ‘Post to LinkedIn profile’!