NVivo lets you explore your data using charts, models and other visualization techniques. They can help you to explore trends, test theories and make sense of what is happening in your source materials.
Display your data in charts
You can create a chart to present or explore the data in your project. For example, you could make a chart to see the nodes that code a source:
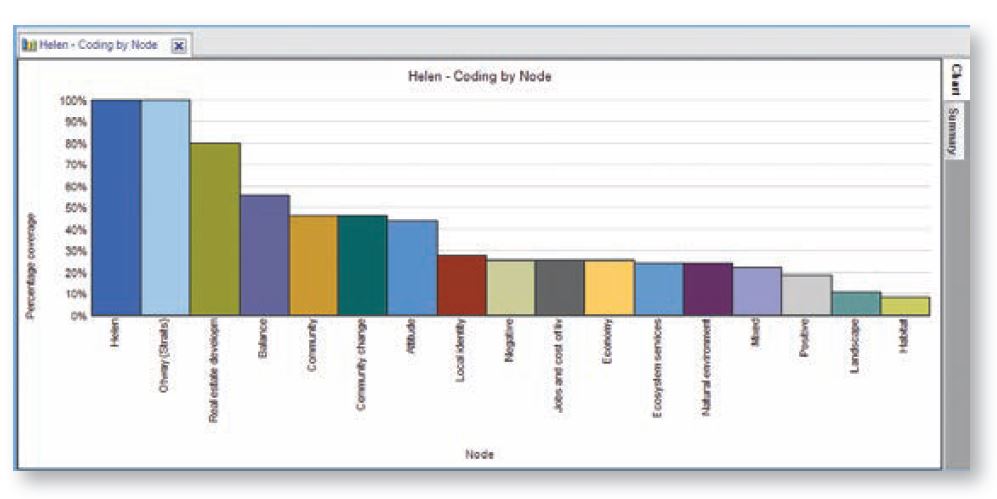
You can create a chart using the Chart Wizard or while working on other areas of your project – for example, you can create a chart based on a node, node matrix or source that you have opened in Detail View.
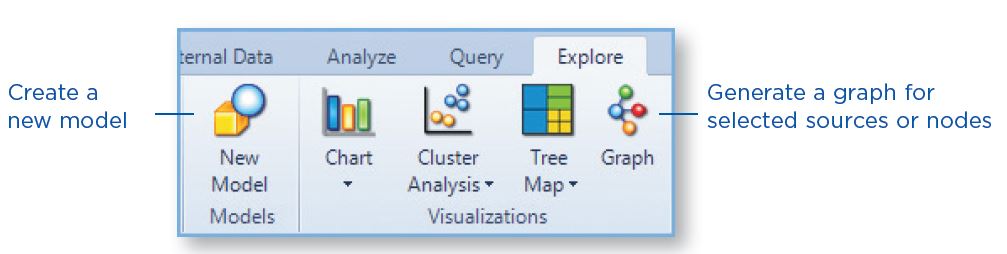
You can also choose from a variety of chart types—for example, 3D bar or column. To launch the Chart Wizard—on the Explore tab, in the Visualizations group, click the Chart image. [Expand]
Create models and graphs to visualize connections
You can create models or generate graphs to visualize, explore and present the connections in your data. You can create models and graphs using options on the Explore tab:
Accompanying video:
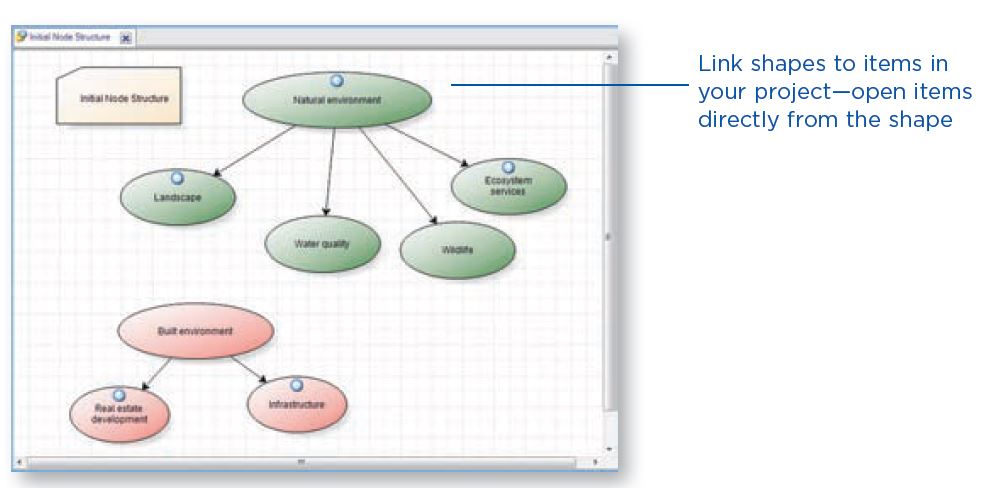
You could create a model to plan your project and sketch your expectations or hypotheses:
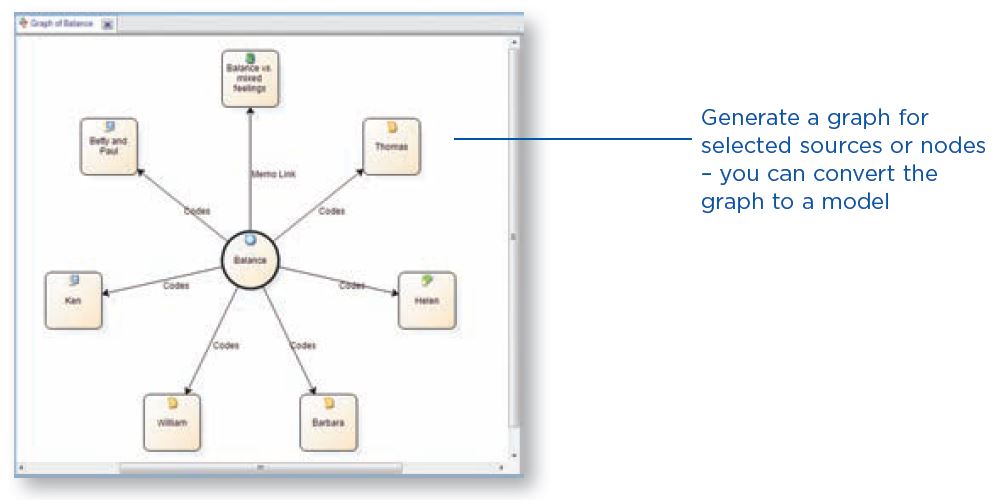
You could also generate a graph to see how project items are connected. For example, you could see which items are connected to a selected source or node.
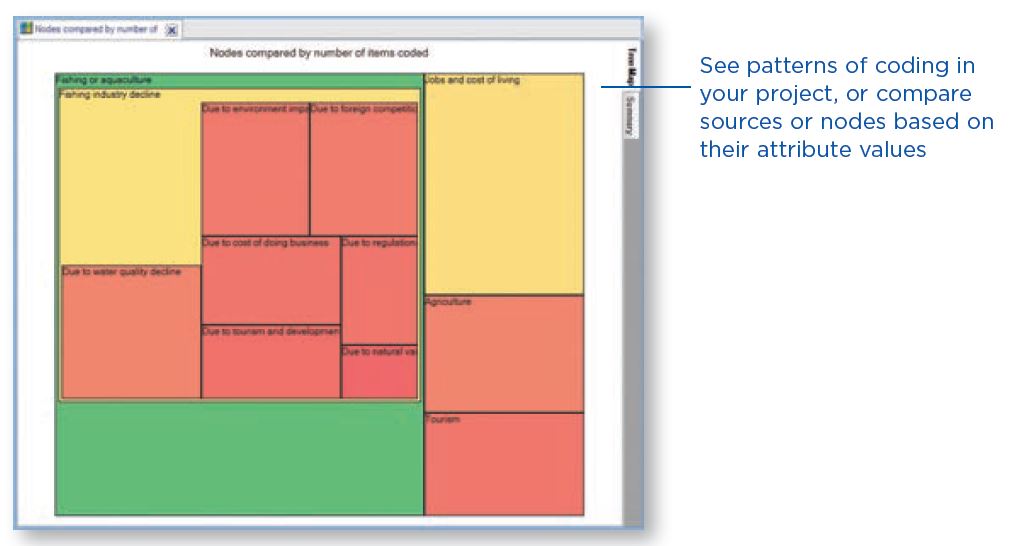
Work with tree maps and cluster analysis diagrams
You can use other visualization techniques to get a different perspective on what is happening in your data—for example:
Use a tree map to compare nodes by the number of references they contain:
Use cluster analysis to group sources or nodes that share similar words, attribute values, or coding:
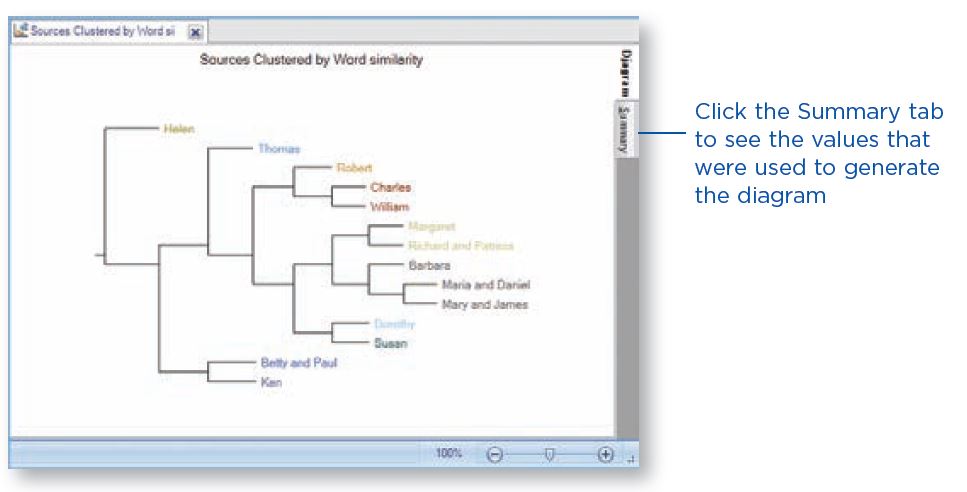
As you work with sources, nodes or query results you can choose to visualize the data.
For example, you can display a cluster analysis diagram for a social media dataset or display a tag cloud for the results of a Word Frequency query.
One thought on “Day 9 – Visualise your project”
Comments are closed.